Query Summary
Summary of query specifications, statistics of extracted data and maps of the extent and coverage of the selected habitat preferences.
Dispersal Probability Maps
Map showing the 'Downstream' (export) or the 'Upstream' (import) dispersal probability from/to the selected port:
Note: Some ports appear twice (i.e. xxx1, xxx2). This represent alternative locations in the 10km grid when the port i located at or near a boundary between two adjacent 10km grids, or where a 10km grid has a high land coverage
Select '1' generation to reflect the direct dispersal, and '2' generations to reflect potential stepping-stone dispersal. Recruitment rate (0-1) represents the theoretical proportion of settled propagules that contribute to the 2nd generation dispersal:
Port Connectivity Matrix
Select minimum 2 ports from the list to generate a matrix showing pairwise dispersal connectivity probabilities between ports:
Select '1' generation to reflect the direct disperal, and '2' generations to reflect potential stepping-stone dispersal. Recruitment rate (0-1) represents the theoretical proportion of settled propagules that contribute to the 2nd generation dispersal:
Cluster Analysis
Cluster analyses are used to identify groups of sub-areas in a network (i.e. 10 km grids) that are more strongly connected than to the rest of the system. Boundaries between clusters can sometimes be interpreted as dispersal barriers allowing limited or no dispersal between the clusters in one or both directions. Two cluster algorithms are included. Louvain (assuming an undirected network) and Infomap (assuming a directional network.)
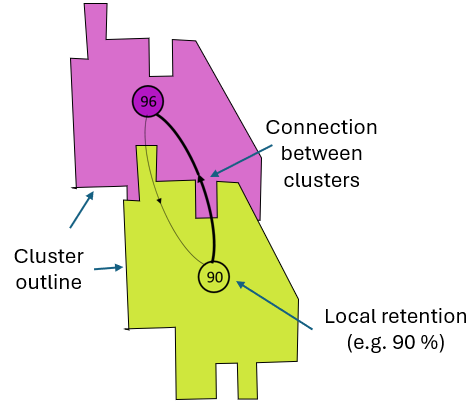
Values in the cluster (colored polygons) centroids (circles) indicate the local retention of each cluster in % of total no. of spawned probagules inside the cluster (Default) or in % of total no. of spawned proabagules that successfully settle inside suitable habitats (Optional), i.e. excluding unsuccessful settlers outside habitat preferences.) The thicknesses of arrows represent the relative strength of export of agents between clusters, relative to the agent export of each cluster. An upper threshold for arrow thickness was set to 10%
Sink/Source Maps
Sink and source areas can be mapped using the metrics from Graph Theory named 'In- and Out-degree' and 'In- and Out-Strength.
In-degree - is the number of nodes (i.e. 10km grid) each node recieves agents from.
Out-degree - is the number of nodes (i.e. 10km grid) each node donates agents to.
In-strength - is the weighted number of nodes (i.e. 10km grid) each node recieves agents from, .
Out-strength - is the weighted number of nodes (i.e. 10km grid) each node donates agents to.
For In-strength and out-strength each connection is weighted by the number of agents the connection is represented by.
Note: In-strength values are normalised to show each node’s share (0–1) of total network imports, so 0.015 equals 1.5% of all imports. Out-strength values are normalised likewise, representing each node’s share (0-1) of total exports, where 0.015 equals 1.5% of all exports.
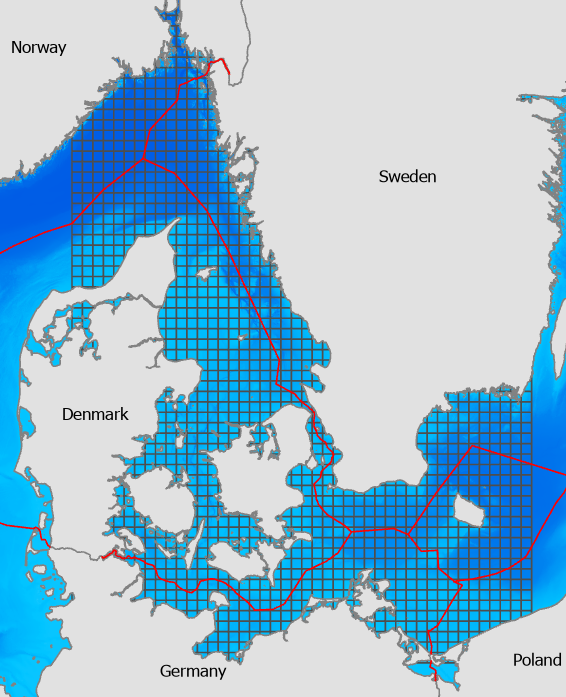
About this tool
This tool is designed to predict the risk of natural dispersal and connectivity of pelagic lifestages of benthic marine non-indigenous species in the transboundary marine and brackish waters of Denmark, Sweden and Germany.
The methodology is based on: Hansen et al. (2024) .
In the left panel species specific traits must be selected:
1. Select a connectivity database
2. Select dispersal traits
3. Select habitat preferences
4. Run Query
QUERYING
The query extracts one connectivity matrix for each combination of spawning date, pelagic larval duration, year, and drift scenario. Each matrix is derived from a biophysical simulation of approximately 100,000 agents randomly distributed across the model domain at the time of spawning. During processing, matrices are filtered to remove connections outside larval salinity thresholds and aggregated into a single connectivity matrix. The final matrix is further filtered to retain only connections consistent with habitat preferences, including seabed substrate, water depth, and seabed salinity.
ANALYSES
Query outputs, including matrix statistics and resulting habitat maps, are presented in the “Query summary” tab. Matrix analyses and associated plots are available in individual tabs, along with relevant metadata and information.
For more details see MCDB documentation .
FUNDING
This work has been funded by the Danish Maritime Fund and the Danisgh Ministry of Higher Education and Science
Contact: Flemming Thorjørn Hansen, flth@dhigroup.com
Cite as:
Hansen FT (2025) Marine Connectivity Explorer. [Shiny web applicaion] https://marineconnectivity.dhigroup.com/, DHI A/S, (accessed YYYY-MM-DD)
Disclaimer:
We provide this website as a service and for informational purposes only. The transmission of this information does not create any form of relationship with us. You should not act upon information provided on this site without seeking our personal assistance. While we have attempted to maintain the information, the software and any other services on this site as accurately as possible, the site may contain errors or omissions for which we disclaim any and all liability. The material and contents posted on this site is provided without warranty of any kind. We are not responsible for any loss of hardware, software or files, caused by the use of the web site or elements downloaded or used from/on the web site. Hence we make no warranty, that the web site or product or services provided on the web site, either by us or on our behalf (including free software downloads) will meet your requirements or will be uninterrupted, timely, secure or without errors, or that the website or the servers we use are free of viruses or bugs or are fully functional or accurate.
Terms of Use:
LIABILITY
Your use of and browsing in this Site is at your own risk. DHI does not warrant that the software used for this Site, and the information, the on-line applications, or any other services provided by means of this Site are error-free, or that their use will be uninterrupted. DHI expressly disclaims all warranties related to the above-mentioned subject matter, including, without limitation, those of accuracy, condition, merchantability and fitness for particular purpose. Notwithstanding anything to the contrary in this Site, in no event shall DHI be liable for any loss of profits, revenues, indirect, special, incidental, consequential, or other similar damages arising out of or in connection with this Site or out of the use of any of the services proposed by means of this Site.