Query Summary
Summary of query specifications, statistics of extracted data and maps of the extent and coverage of the applied habitat preferences.
Dispersal Probability Maps
Select a port from the list and chose to plot a map showing the 'Downstream' (export) or the 'Upstream' (import) dispersal probability from/to the selected port:
Note: Some ports appear twice (i.e. xxx1, xxx2). This represent alternative locations in the 10km grid when the port i located at or near a boundary between two adjacent 10km grids, or where a 10km grid has a high land coverage
Select '1' generation to reflect the direct dispersal, and '2' generations to reflect potential stepping-stone dispersal. Recruitment rate (0-1) represents the theoretical proportion of settled propagules that contribute to the 2nd generation dispersal:
Port Connectivity Matrix
Select minimum 2 ports from the list to generate a matrix showing pairwise dispersal connectivity probabilities between ports:
Select '1' generation to reflect the direct disperal, and '2' generations to reflect potential stepping-stone dispersal. Recruitment rate (0-1) represents the theoretical proportion of settled propagules that contribute to the 2nd generation dispersal:
Cluster Analysis
Cluster analyses are used to identify groups of sub-areas in a network (i.e. 10 km grids) that are more strongly connected than to the rest of the system. Boundaries between clusters can sometimes be interpreted as dispersal barriers allowing limited or no dispersal between the clusters in one or both directions. Two cluster algorithms are included. Louvain (assuming an undirected network) and Infomap (assuming a directional network.)
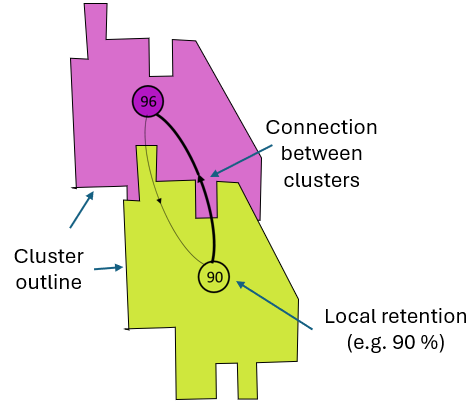
Values in the cluster (colored polygons) centroids (circles) indicate the local retention of each cluster in % of total no. of spawned probagules inside the cluster (Default) or in % of total no. of spawned proabagules that successfully settle inside suitable habitats (Optional), i.e. excluding unsuccessful settlers outside habitat preferences.) The thicknesses of arrows represent the relative strength of export of agents between clusters, relative to the agent export of each cluster. An upper threshold for arrow thickness was set to 10%
Sink/Source Maps
Sink and source areas can be mapped using the metrics from Graph Theory named 'In- and Out-degree' and 'In- and Out-Strength.
In-degree - is the number of nodes (i.e. 10km grid) each node recieves agents from.
Out-degree - is the number of nodes (i.e. 10km grid) each node donates agents to.
In-strength - is the weighted number of nodes (i.e. 10km grid) each node recieves agents from, .
Out-strength - is the weighted number of nodes (i.e. 10km grid) each node donates agents to.
For In-strength and out-strength each connection is weighted by the number of agents the connection is represented by.
About this tool (beta-version)
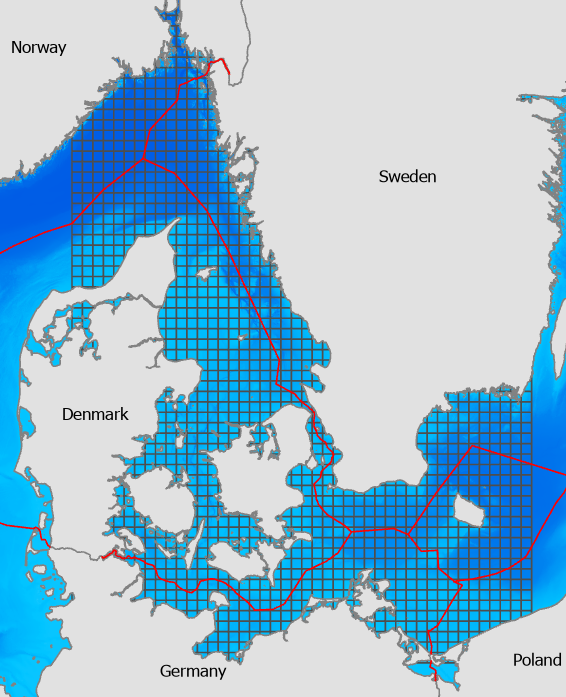
This tool is designed to predict the risk of natural dispersal and connectivity of pelagic lifestages of benthic marine non-indigenous species in the transboundary marine and brackish waters of Denmark, Sweden and Germany.
The methodology is based on: Hansen et al. (2024) .
In the left panel species specific traits must be selected:
1. Select a connectivity database
2. Select dispersal traits
3. Select habitat preferences
4. Run Query
QUERYING
The query extracts 1 connectivity matrix for each combination of spawning date, pelagic duration, year, and drift scenario.
Each matrix is based on a biophyscial simulation of approximately 100 000 agents distributed randomly within the model area at the date of spawning.
During the query, each matrix is filtered to exclude connections outside larval salinity thresholds and summarized into one resulting matrix.
The resulting matrix is then filtered to include only connections within habitat preferences incl. seabed substrate, water depth and seabed salinity.,
ANALYSES
Query ouputs in terms of matrix statistics and resulting habitat map is shown in the 'Query summary' tab.
Access to matrix analyses and plots are available in individual tabs including information.
For more details see MCDB documentation .
FUNDING
This work has been funded by the Danish Maritime Fund and the Danisgh Ministry of Higher Education and Science
Contact: Flemming Thorjørn Hansen, flth@dhigroup.com